How Enmon runs building energy management
Most companies have their energy data scattered across four places. Enmon pours it into one app and turns it into savings, alerts and reports. This is the journey your data takes, from meter to money saved.
one version of the truth
one version of the truth
What is energy management?
A continuous process of collecting and evaluating energy consumption data across buildings and operations. It covers real-time monitoring, invoice checks, fault alerts and the numbers you need to decide on savings.
It’s not an Excel sheet with monthly readings, nor an audit filed away in a binder. It’s a way to manage energy continuously, not once a year in hindsight.
Every meter can feed Enmon. Even the one from 1998.
Where it pays off, we fit a sensor. Where it doesn’t, a QR code and a phone will do. The result is the same: every meter in one app.
Online readings
automatic · every 15 minutesWe fit a sensor to your existing meter and data flows in by itself. Where measured data already exists (a BMS, the distributor’s portal, a vendor API) we connect directly.
- No meter replacement.
- You see an anomaly the same day, not on the invoice.
Offline readings
manual · e.g. once a monthWe stick a QR code on the meter. Anyone scans it with a phone, types in the reading and sends it to Enmon. Two minutes, no training.
- For meters where a sensor doesn’t pay off.
- Even rough data shows which building deserves detailed metering.
Break the thermostat. Enmon speaks up.
This exact thing happened in an office park: a broken thermostat heated a ramp 24 hours a day and nobody saw it in an €80 thousand invoice. Here you can replay it yourself.
Fault caught in 15 minutes. Without Enmon it would have run for months. In the real case it cost €2 to 3 thousand a month.
This is how alerts work. Set the building’s operating hours, drag the threshold line in the chart, and Enmon keeps watch for you. Phone notification, e-mail or Teams.
Can you find the penalty on this invoice?
An electricity invoice has nine line items and accounting has about a minute for it. Enmon machine-reads every line and checks it against history and actual consumption.
Which building is the real energy hog?
A small store, old lighting, a leaky envelope. Invisible in absolute numbers; per square metre, the chain’s second biggest problem.
Enmon recalculates per m², per product, even per hotel guest. And it compares only the comparable: you tag buildings by technology, so an LED store never competes with a halogen one.
How much do you pay for energy?
Paying over €2 000 a month? Then Enmon’s payback is just a matter of time.
Get a consultationFrom binders to data in a few weeks
Meter inventory
We map every supply point and meter. The first real order in your energy setup. Illegal draws and forgotten contracts turn up more often than you’d think.
Connectivity analysis
We measure IoT signal strength at every meter.
Remote reading installation
Pareto rule: 20% of meters drive 80% of consumption, so we start with the billing ones.
Implementation
Buildings, meters, users, alerts, history.
Onboarding
We train your team to work with the system.
Trial run and second training
After two months we fine-tune how you work with the system.
Operation and optimisation
Finding savings and improving as you go.
Software won’t change a light bulb on its own
Energy management only works when somebody works with the data. We have clients who opened the system twice in six months. That’s exactly why our external energy manager service exists.
Every month our expert goes through your data, sends a report and walks you through where you’re leaving money on the table. No recruiting, no salary on your payroll, no waiting.
Companies routinely spend years hunting for an energy manager; HOPI searched for five.
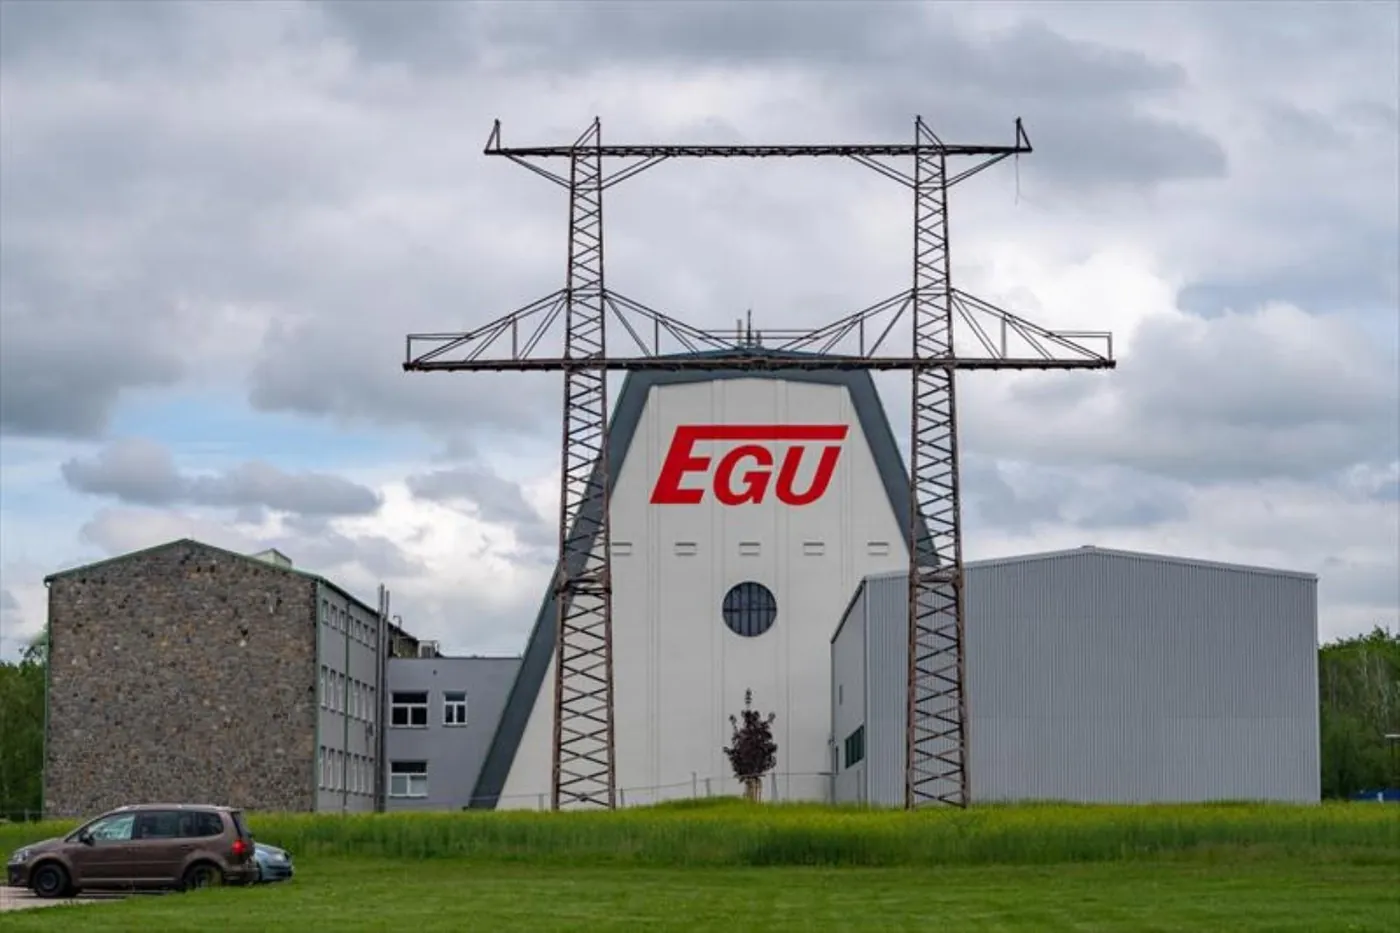
EGÚ HV Laboratory took the same route. Their own team has no time to review the data regularly, so they are arranging it with our external energy manager. Read the story
- Monthly report in your inbox
- A meeting over the data
- Savings proposals with numbers attached
"With the number of test rigs still growing, it was important for us to keep that growth in consumption under control. That is exactly what Enmon lets us do."
Frequently asked questions
See how to digitise your energy management
Send us a few invoices and the number of buildings. We’ll prepare a screening and suggest where to start.