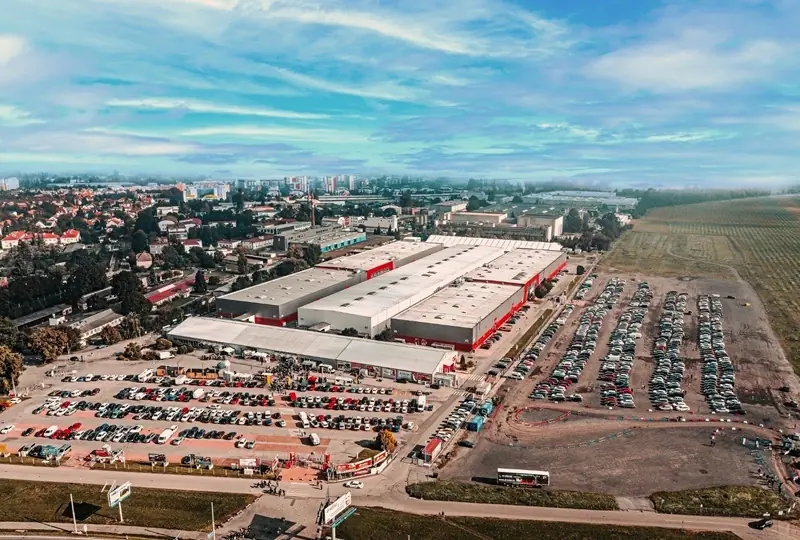
PVA EXPO PRAHA is the second largest exhibition centre in the Czech Republic. Around 120 events, eight thousand clients and three quarters of a million visitors pass through it every year. Its consumption changes from one day to the next: 50 kW when idle, more than 1,000 kW during a large trade fair.
A site that was managed on foot
One hundred and five thousand square metres in Prague Letňany. Eight exhibition halls covering 37,000 m², ten thousand square metres of outdoor space, three entrance halls, thirteen conference rooms seating five thousand, 2,500 m² of offices and, recently, a hotel.
"Until then we were on a fully analog system. Someone from the control room had to get up and run each building separately."
Energy purchasing rested on historical estimates. Assigning consumption to a particular hall or a particular event was effectively impossible, and putting an energy report together took the team a full week.
Two pressures that settled it
The first arrived with the energy crisis of 2020 and 2021. The second came two years later with ESG.
Large corporate clients now want consumption data as part of the tender. How much energy an event used, how much water, what carbon footprint it left behind.
"If we could not supply this data, we would rule ourselves out of the running for clients like Škoda. We needed to move from educated estimates to current data available at any moment."
The second pressure was penalties for exceeding reserved capacity. Rentals are booked at short notice: a contract for a November event can land in October, and the electricity order no longer makes it in time. Ad hoc rentals and film crews raise the draw without any warning at all. Between June 2025 and February 2026 the centre paid CZK 496,262 in penalties.
First, find out what is actually metered
Before digitisation came the survey: map the site and fit the meters.
The estimate was twelve meters. There were 35. Among them a historic meter with a magnetic wheel.
We documented every meter, tagged it with a QR code, put it on a digital map of the site and prepared it for automatic or mobile reading. That inventory turned out to be the foundation of the whole project.
Deploying Enmon
New meters send data over NB-IoT sensors. Older ones we fitted with wireless modules or wired into mobile readings via QR codes. The result is a single real-time view of consumption used by facility managers, the sales department and management alike.
Automatic anomaly alerts are part of it. A water leak at night shows up within hours, not on the monthly invoice.
"We do not want to build our own CRM or our own energy management. That is why companies like PKV exist."
What the data showed
Over 60 % of consumption had no submetering. Three older halls had none, yet more than sixty percent of the site’s total consumption flowed through them. Without submeters there was no way to tell where the energy went, or to attribute costs to a given event.
Reserved capacity can be planned. Quarter-hour data revealed the peaks and how individual events behave. It also showed that buying capacity with a margin and paying for the unused part can work out better than paying a penalty for exceeding it.
Energy stopped being a flat cost. The centre now knows the energy intensity of each hall and reflects it in the rental price. Every hall used to be priced practically the same.
ESG reporting went from a week to minutes. What used to mean a week of manual work is now a matter of minutes.
"If we cannot measure it and do not have it in numbers, it stays a virtual discussion about where the consumption is going."
What comes next
Fitting submeters into the older halls, connecting the new hotel and office building, calculating the site’s carbon footprint, forecasting consumption to plan reserved capacity, and testing the business case for battery storage.
The centre also has an approved grid connection for a 1 MW solar plant and a project for 36 carports with photovoltaics and chargers.
"Energy management is not an add-on today. It is the basis for running an organisation."